Control Testing
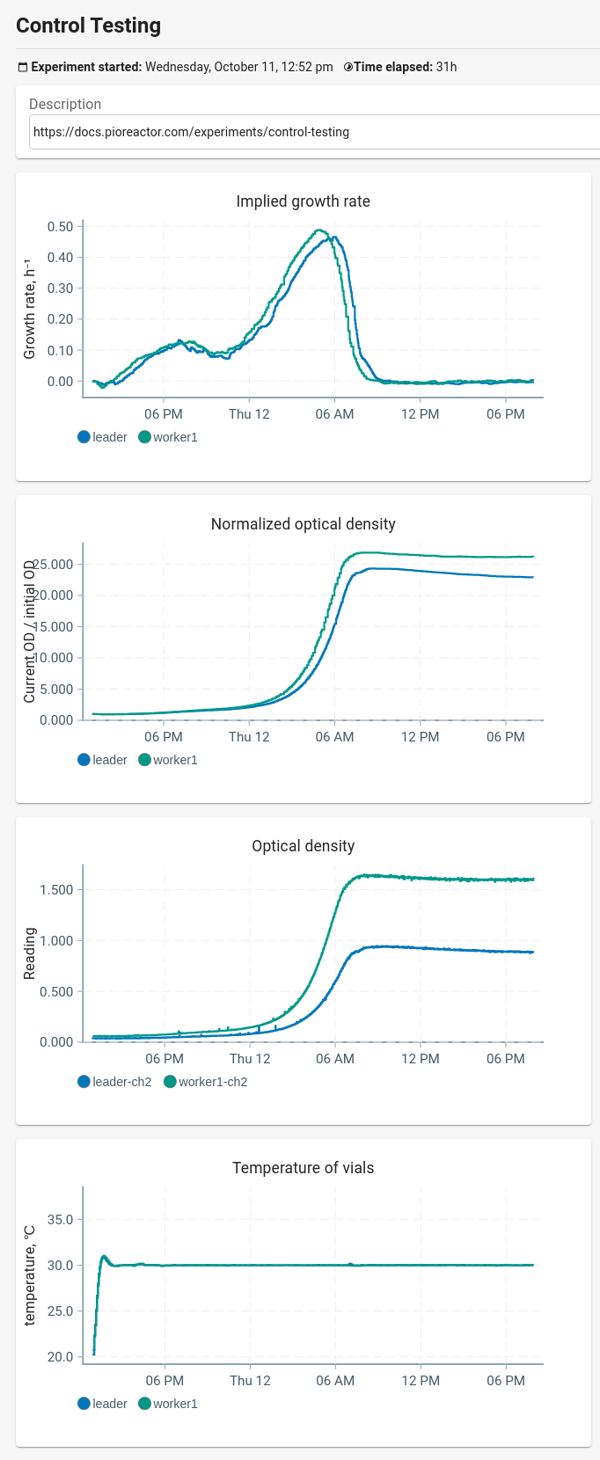
To ensure that the Pioreactors we’re using are working as expected, we ran an experiment where we used the exact same experimental conditions with two Pioreactors, with the hope to produce the same results.
The original experiment is described on the Pioreactor website.

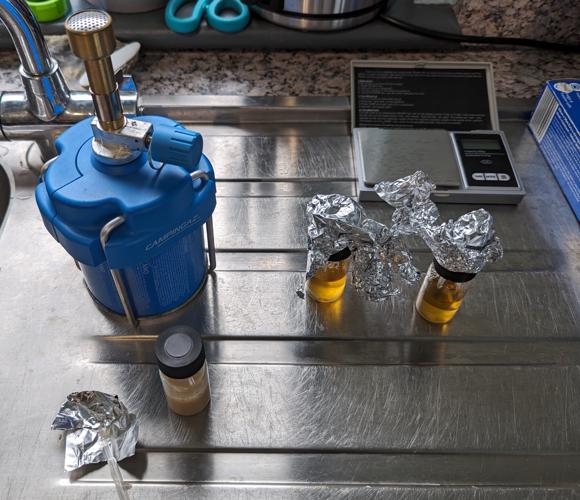
A bunsen burner, small weight scale, three vials and a dropper. Two of the vials contain YPD broth and are covered with aluminium foil. The other vial contains stock solution.
Kit List
- 2 x Pioreactor 20 ml - see our thoughts on Pioreactors
- 2 x Raspberry Pi Zero 2 W with header
- 2 x Raspberry Pi 15W USB-C Power Supply
- 2 x Micro SD cards
- 3 x 20mL vials
- Another computer on the same network as the Raspberry Pi with a web browser
- Pressure cooker to ‘autoclave’
- Aluminium foil to cover the vessel ports
- Distilled water
- Baker’s yeast
- Digital pocket scale
- YPD broth
- Measuring cup
- Dropper/pipette
Protocol
Preparing and sterilizing the media
- Prepare YPD broth media for three 15mL vials.
- Pour 300mL tap water into the pressure cooker, place the three vials on the metal trivet in the pressure cooker and turn to a high setting.
- Once the water in the cooker starts to boil, steam will come out of the open valve. Put the heaviest weight (15lb) weight on top of the valve.
- The steam will lift the weight and start to escape. As soon as the steam starts to escape, start timing the sterilization and turn down the heat so that the steam is only just escaping and not rushing out. Aim to maintain a gentle hissing.
- After 20 minutes turn off the heat and leave to cool.
- Wait until pressure is completely reduced then lift the weight off the valve allowing any remaining steam to escape. Never open the pressure cooker until the steam valve has been opened to release the pressure.

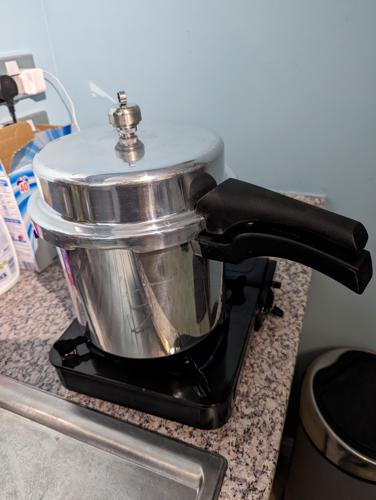
Using a pressure cooker on a gas stove as an autoclave
Running the experiment
- Dilute a small amount of baker’s yeast in 15mL of YPD broth media
- Innoculate the three sterile vials with the same amount (just a drop) of culture from the stock solution.
- Wipe the vials and place them in the Pioreactors.
- Start a new experiment on your Pioreactor dashboard.
- Select Manage all Pioreactors
- Start Stirring activity
- Start Temperature automation activity and set to 30°C
- Start OD reading activity
- Go back to the graphs and check that an Optical Density (OD) signal is being received.
- Select Manage all Pioreators again and start Growth rate.

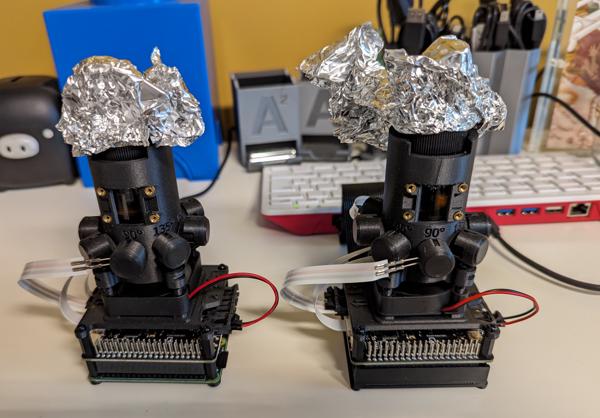
Two Pioreactors standing side by side, with the one on the right connected to a Raspberry Pi 400
Results
The raw results from the experiment are available as CSV files on GitHub.

A screenshot of the Pioreactor results
Report
Feedback
Was this page helpful?
Glad to hear it! Please tell us how we can improve.
Sorry to hear that. Please tell us how we can improve.